visualizing powerful statistics, powerfully.
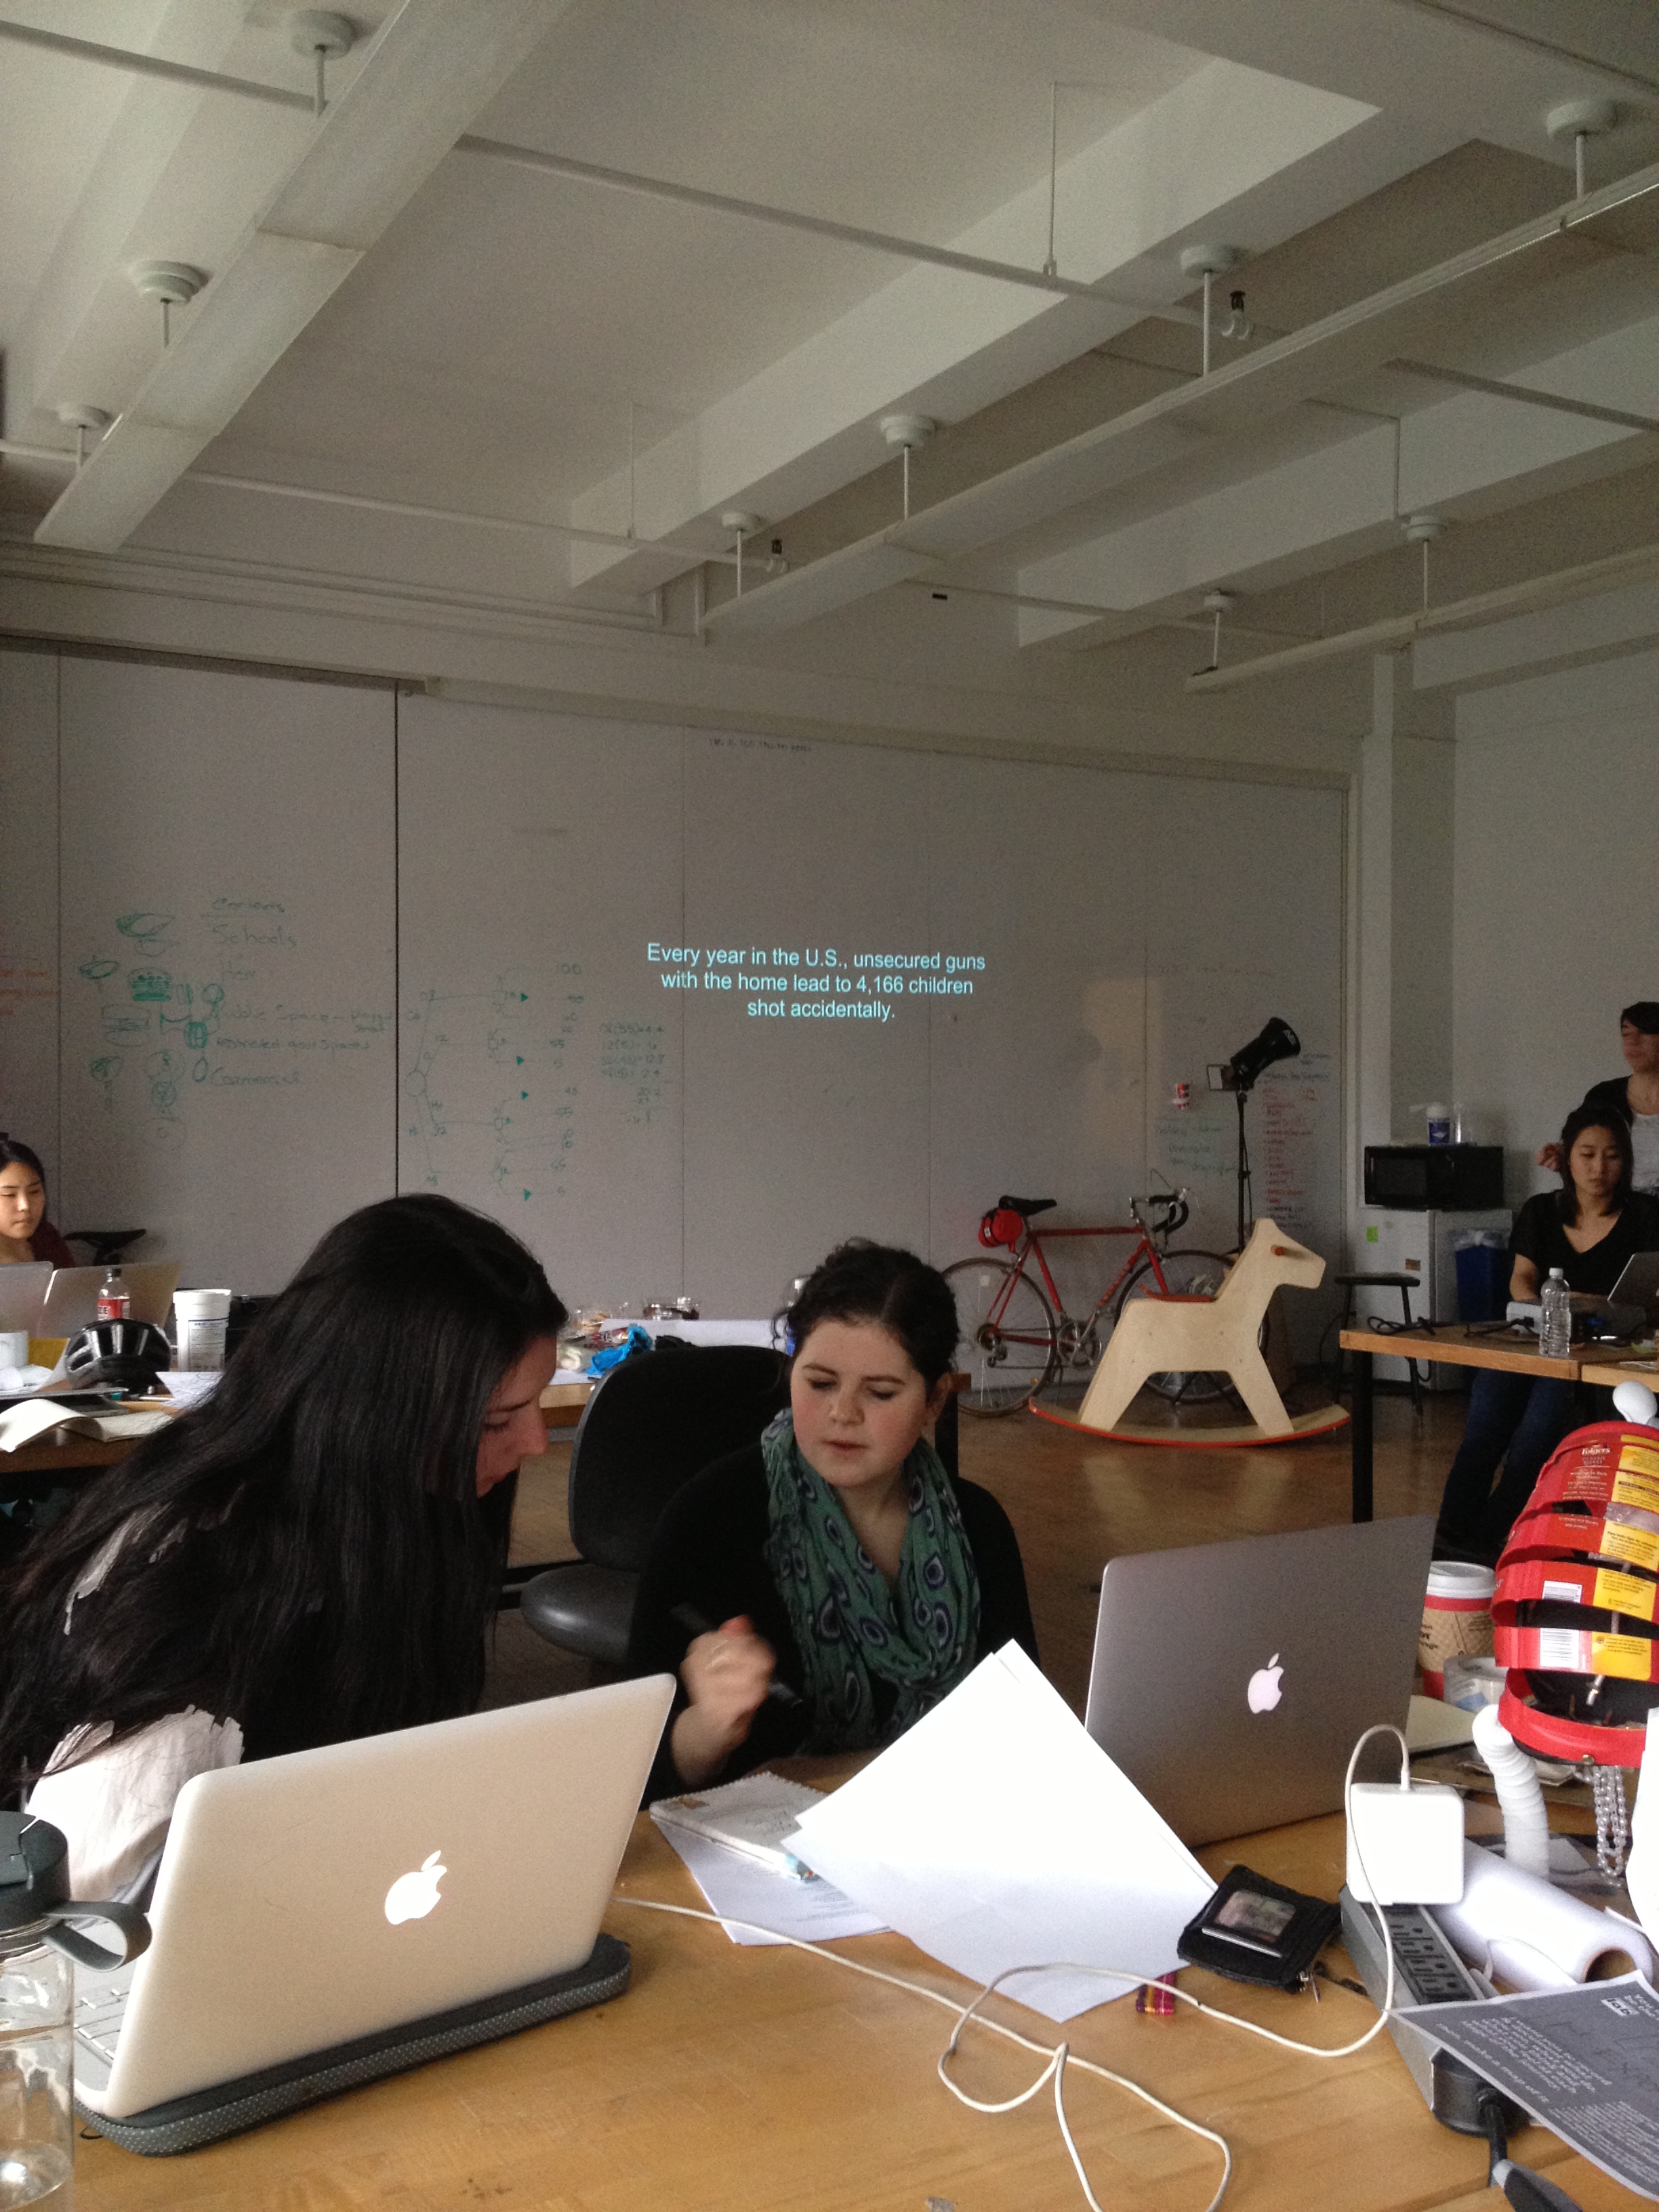
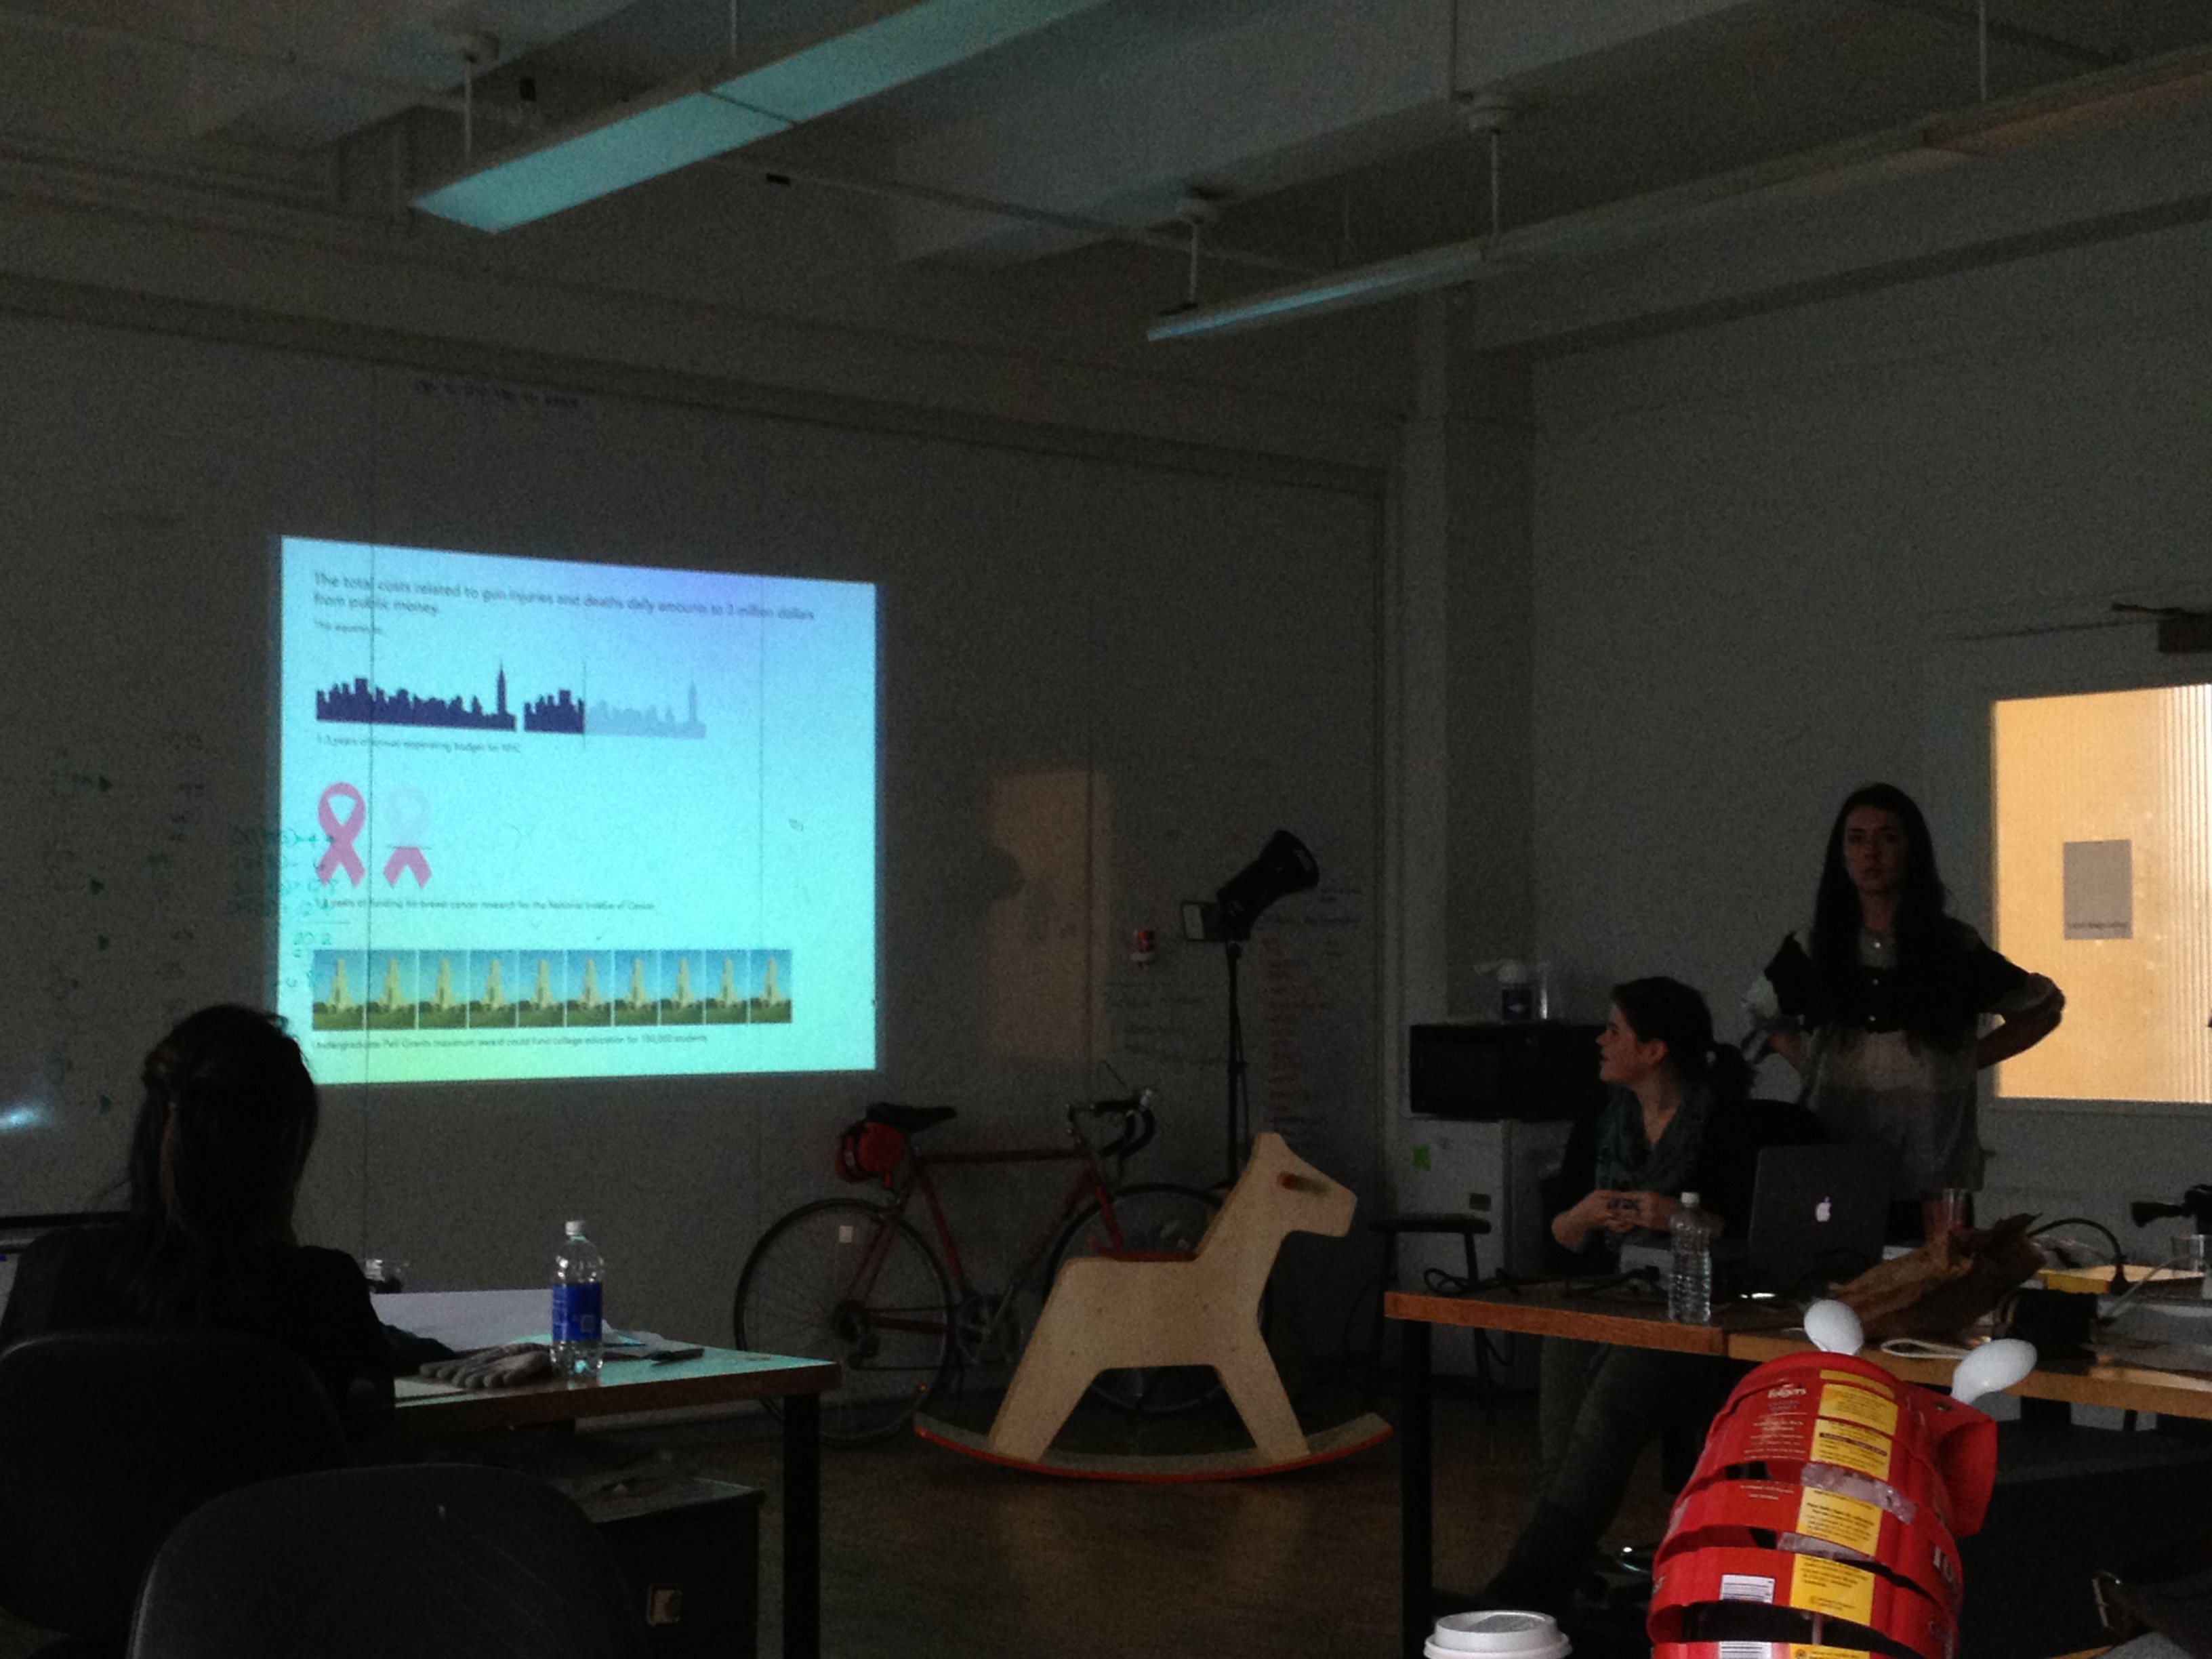
On Wednesday, February 13th, the class reflected a bit on what we’ve learned so far and came up with what we thought were the most shocking, moving, surprising, or otherwise powerful statistics surrounding guns, gun deaths, and children. We then set about thinking about the most meaningful ways to represent those statistics — be it via graphics, film, objects, or some other means. The idea was to make the statistics more than just numbers, since numbers are often hard to wrap one’s head around in a concrete way (what is a billion? what is 3% of a billion? what does that look like? what does it feel like?)
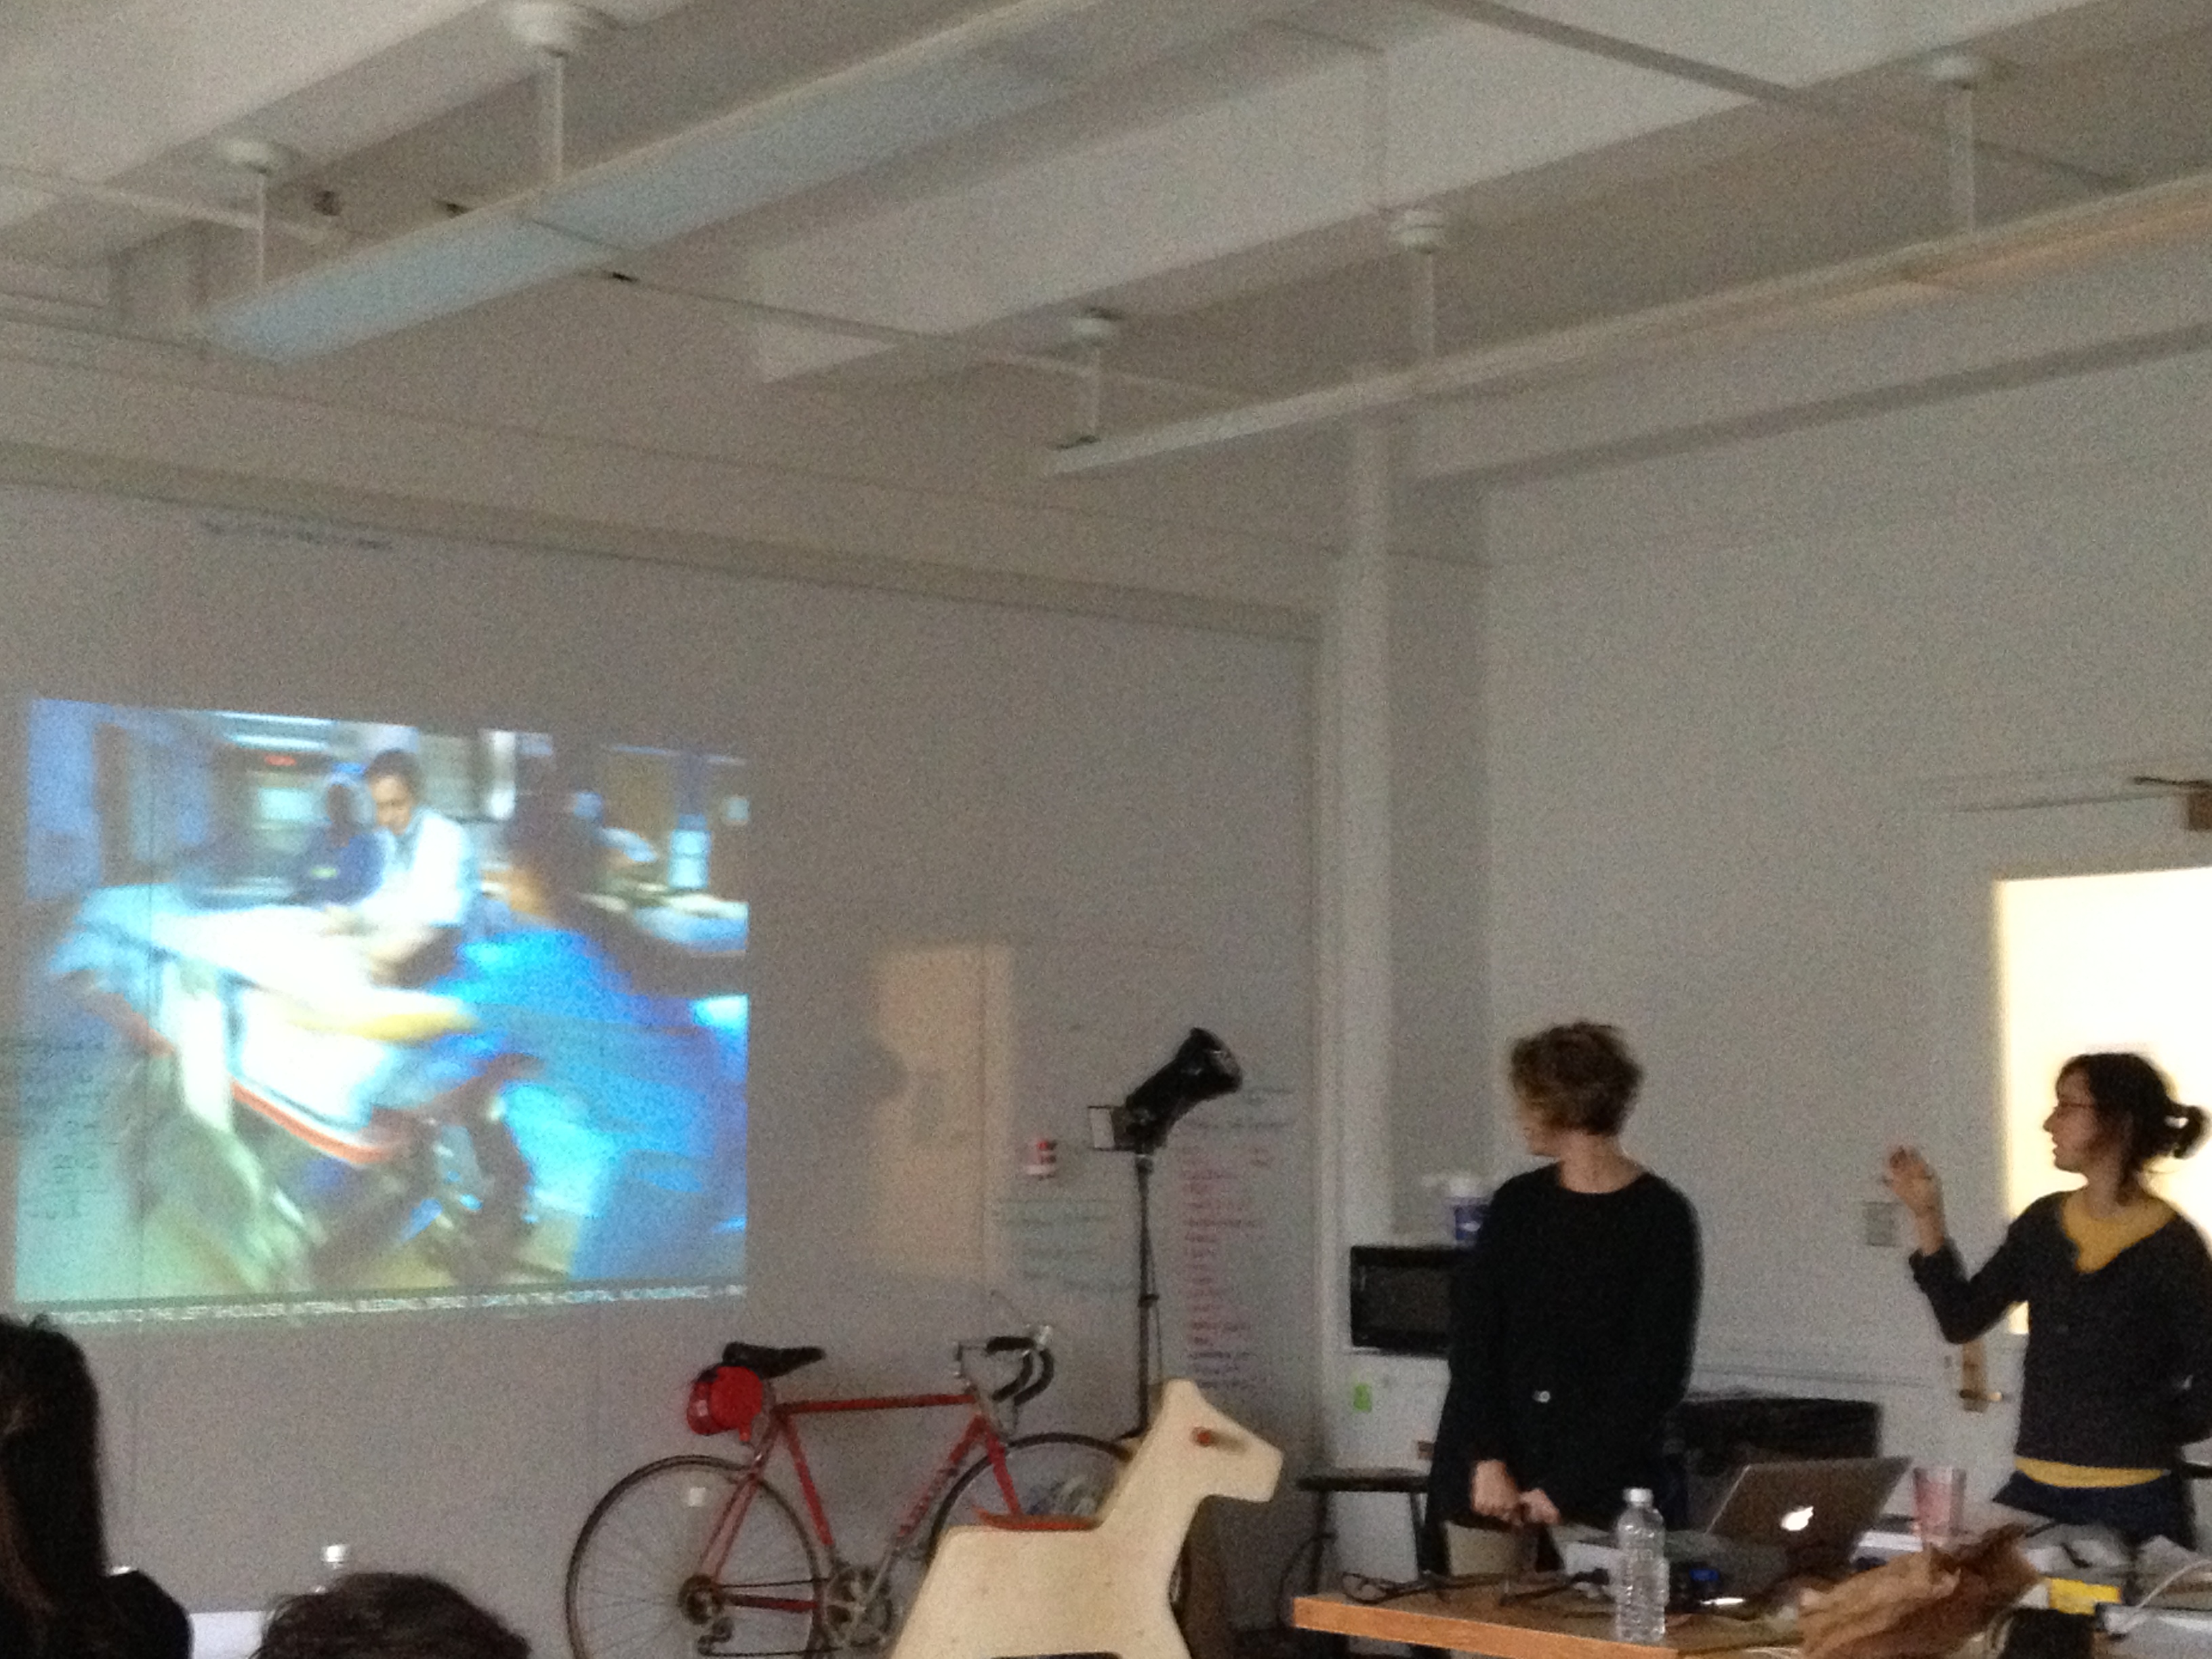
After about an hour’s worth of brainstorming and sketching, each pair of students presented back to the group about their particular statistic and how they chose to represent it. See some of the presentations below, or in our blog posts!